Argus
Argus - Power MonitorPower Dashboard
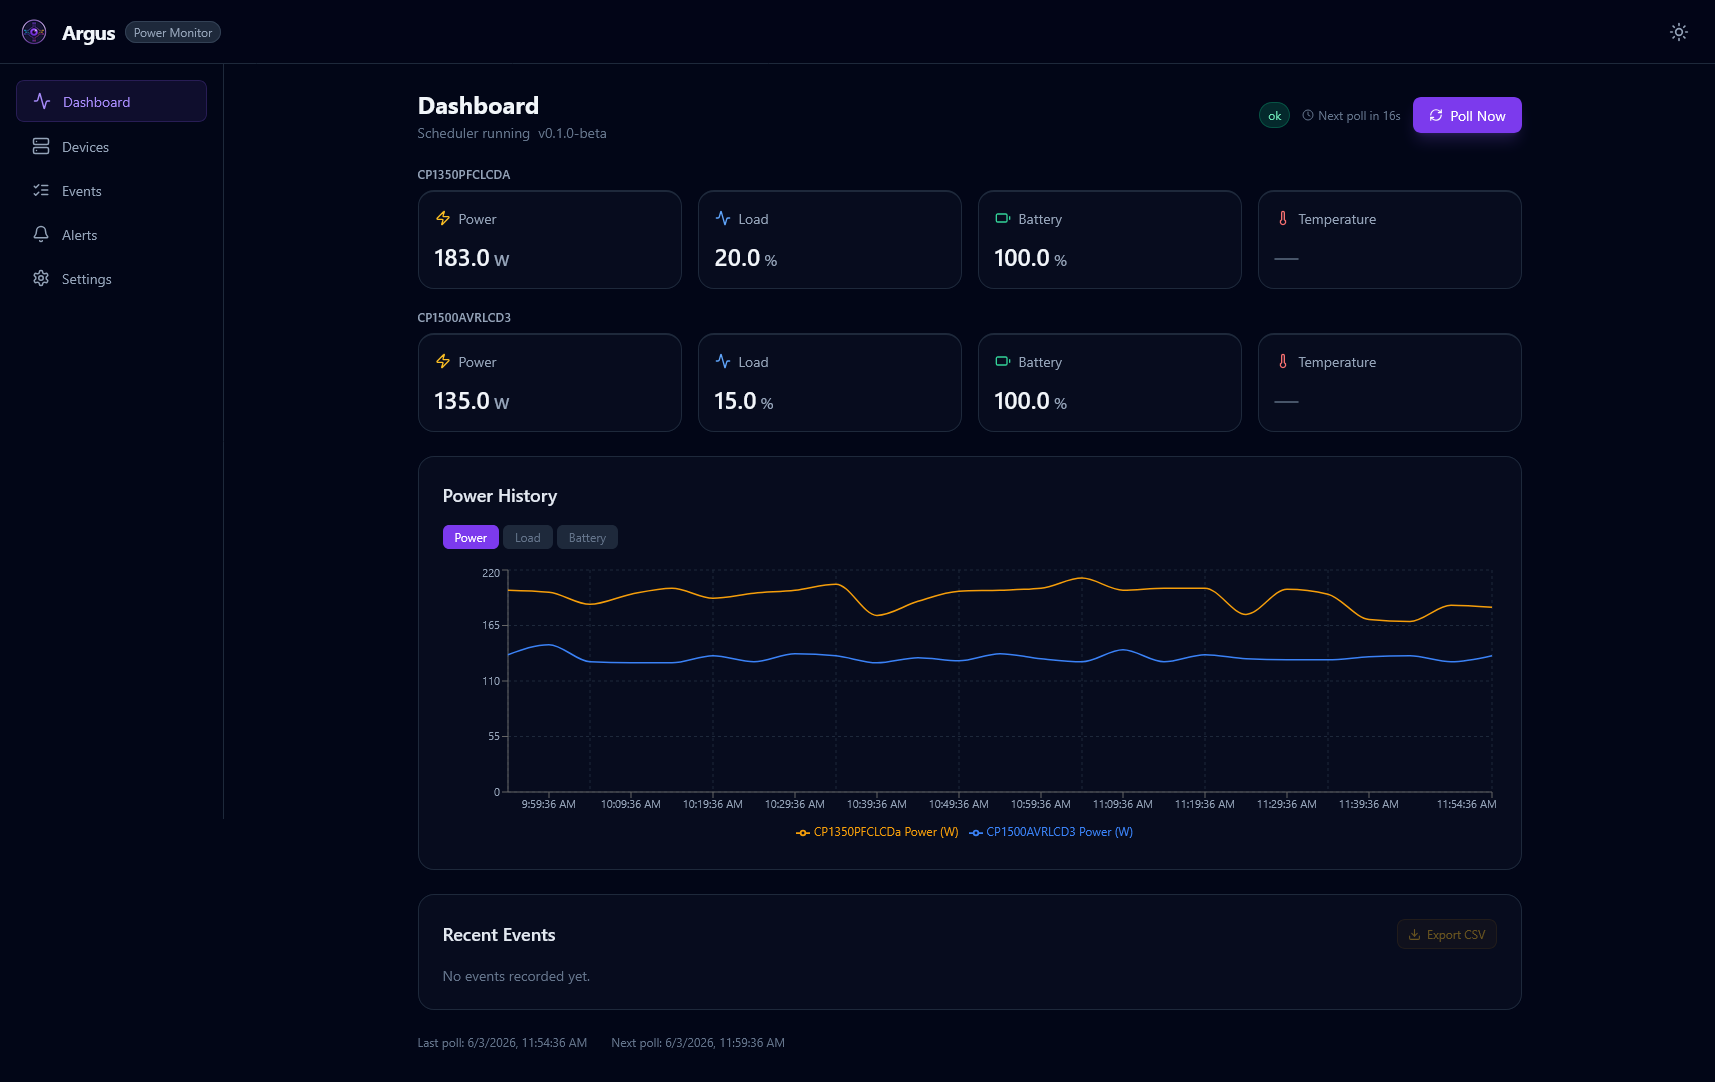
Argus dashboard and event screenshots.
About This Project
Project Overview
Argus is a self-hostable power monitoring platform that polls UPS and power devices, stores telemetry, and provides a web UI plus REST API for operations. It is designed for home-lab and small infrastructure environments that need continuous visibility into power quality, runtime, and outage events.
Technical Implementation
- Two-container architecture: A scheduler container handles polling, event processing, and exporters, while a FastAPI container serves the React frontend and API routes.
- Multi-source polling: Argus collects snapshots from NUT and SNMP devices, normalizes records, and dispatches them through a shared pipeline.
- Pluggable exporters: Snapshots can be exported to SQLite, Prometheus, InfluxDB, Loki, CSV, and an energy accumulator for kWh/cost tracking.
- Runtime reconfiguration: Poll interval, enabled exporters, alert provider settings, and scheduler state can be changed from the UI/API without restarts.
- Observability-first operation: Native metrics and structured logs integrate directly with Prometheus, Loki, Grafana, and Alloy relay workflows.
- Secure-by-default API layer: Optional API key auth, rate limiting, request-size limits, CORS controls, security headers, and HTTPS-only alert URL validation.
Development Journey
Argus evolved from a focused UPS telemetry collector into a full power-observability platform with event intelligence, alerting, and production-oriented operations guidance. The project matured into clear scheduler/API boundaries, added richer integrations and diagnostics, and now supports robust self-hosted deployments with strong test coverage across backend and frontend layers.
Key Features
- Continuous polling for NUT and SNMP power devices
- Power snapshots, device status, and event timeline APIs
- Event detection for on-battery, power-restored, battery-low, and offline states
- Alerting providers with cooldown controls and test endpoint support
- Exporter pipeline for SQLite, Prometheus, InfluxDB, Loki, CSV, and energy totals
- Grafana-ready metrics and logs for operational dashboards
- UI + API controls for manual trigger and runtime config updates
- Security hardening for self-hosted production environments